|
Deprecated
|
Jarvis /
ScreenShots
Version 0.1
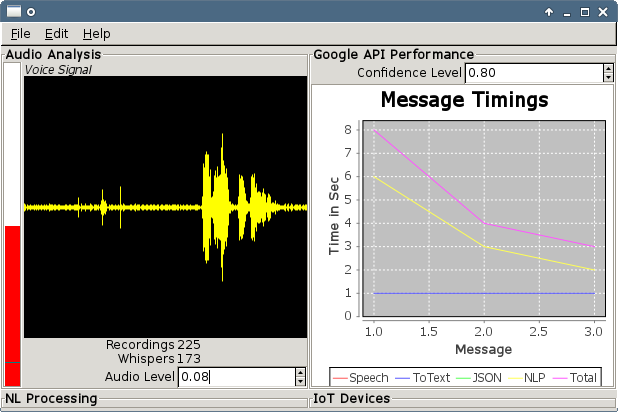
In this screenshot the volume meter is shown in red on the left in the Audio Analysis panel, with a small bar near the bottom showing the current Audio Level. Below the audio level is where noise is filtered out. To the right of the audio level is the Voice Signal graph. This shows the last signal accepted for submission to Google's Speech API. Below this are the number of recordings made and the number of those that are considered whispers, re: too low to identify as a voice (ie in the noise level range). Jarvis ignores silence and keystrokes, for example. Both are considered "noise". In the panel labeled Google API Performance is a graph showing the time it takes for the four major processing points of a recording: speech recording, conversion to text via Google Speech API, parsing of the JSON returned by Google, and processing by the NLP code to generate a command (such as "speak" or "quit"). Two panels remain unfilled in this version: The NLP Processing panel and the IoT Services panel. The former will provide some additional feedback on converting the JSON responses from Google into real commands while the latter will provide configuration information for available IoT devices to which commands may be sent. |